- Home
- Task 1 Lessons & Tips
- Compare & Contrast Language
Compare and Contrast Language for Graphs
The purpose of this lesson is to introduce you to compare and contrast language which is needed to write about graphs. You will need to make comparisons in line, bar and pie charts, and also tables.
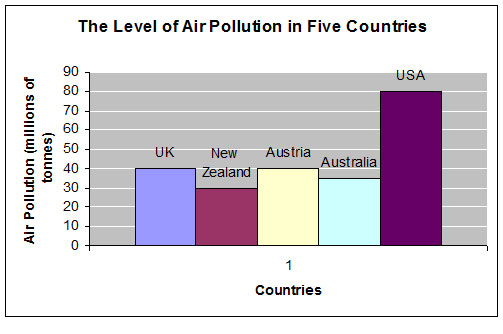
To begin, take a look at the graph below.
- Which country has the highest level of pollution?
- Which country has the lowest?
The country with the higest level of pollution is USA and the country with the lowest is New Zealand.
The Key Language
Comparative and Superlative Adjectives
Being able to compare and contrast data is an essential skill for IELTS writing, especially in Task 1. Comparatives and superlatives are one common way to do this.
Comparatives are used to compare two things:
Leopards are faster than tigers.
Superlatives are used to compare one thing against a group of others:
The leopard is the largest of the four big cats.
Here are the basics of how they are formed:
| Example Word | Comparative | Superlative | |
|---|---|---|---|
| Words with one syllable | high | higher | the highest |
| Words with three syllables or more | productive | more productive less productive |
the most productive the least productive |
| Words ending in –y | wealthy | wealthier | the wealthiest |
| Short words ending with a consonant/vowel/consonant | hot | hotter | the hottest |
| Irregular | good | better | the best |
Other Important Language
Comparatives and superlatives are useful to compare and contrast, but they won't be enough.
Here are some other useful words and structures:
Transitions
- The Middle East produces high levels of oil; however, Japan produces none.
- The USA produces large amounts of natural gas. In contrast, South Korea produces none.
- European countries make great use of solar power. On the other hand, most Asian countries us this method of power generation very little.
Subordinating Conjunctions
- The Middle East produces high levels of oil, whereas / while Japan produces none.
- Whereas / While the Middle East produces high levels of oil, Japan produces none.
- Although the Middle East produced 100 tons oil, Japan produced none.
Other Structures
- Developing countries are more reliant on alternative energy production than developed countries.
- Solar power accounts for far less of the total energy production than gas or coal does.
- Hydropower is not as efficient as wind power.
- Like Japan, South Korea does not produce any natural gas.
- The Middle East produces twice as much oil as Europe.
- Western countries consume three times more oil than the Middle East.
- Russia consumes slightly more oil than Germany.
- The UAE produced the same amount of oil as Saudi Arabia.
Using Approximate Data
When you compare and contrast, you also need to learn phrases so you can refer to data that is not exact.
For example:
“just over 7 million tonnes” |
|
“nearly 70 million tonnes” |
Compare and Contrast Language Practice
Look at the table below. What is being compared?
Natural Gas Consumption and Production, 2001
Country |
Consumption* |
Production* |
The USA |
588.9 |
500.0 |
The United Kingdom |
86.1 |
97.3 |
The Former Soviet Union |
7.1 |
0.4 |
The UAE |
30.0 |
35.9 |
Australia |
19.1 |
28.0 |
Japan |
68.6 |
0 |
New Zealand |
4.9 |
5.1 |
South Korea |
18.9 |
0 |
China |
24.3 |
25.0 |
*in millions of tonnes
Compare and Contrast Language Quiz
Look at the compare and contrast language in the drop down box and choose the correct word to complete the sentences.
Comments
Any comments or questions about this page or about IELTS? Post them here. Your email will not be published or shared.
Band 7+ eBooks
"I think these eBooks are FANTASTIC!!! I know that's not academic language, but it's the truth!"
Linda, from Italy, Scored Band 7.5
