- Home
- Task 1 Lessons & Tips
- Graph Prepositions
Practice Prepositions in Graphs
It is very important that you know how to correctly use prepositions in graphs in the IELTS writing task 1. Certain prepostions go with certain words when you use the language of change.
If you put them in the wrong place or use the wrong preposition you may confuse what you are trying to say.
First, take a look at this graph model answer and notice how some of the prepositions in the graph are used. They have been highlighted.
Model Answer
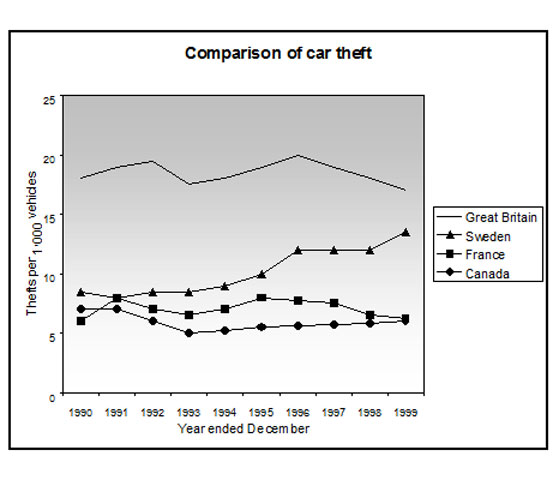
The line graph compares the number of car thefts for every thousand vehicles in four countries from 1990 to 1999. Overall, it can be seen that car thefts were far higher in Great Britain than in the other three counties throughout the whole time frame.
To begin, car thefts in Sweden, France and Canada followed a fairly similar pattern over the first five years, all remaining at between 5 and 10 per thousand. The general trend though for France and Canada was a decline in the number of vehicles stolen over the period, with both at around 6 in 1999. In contrast, Sweden experienced an upward trend, starting the period at approximately 8, and finishing at just under 15.
Interestingly, car thefts in Great Britain started at 18 per thousand, which far exceeded that of the other countries. It then fluctuated over the next nine years, reaching a peak of 20 thefts per 1000 in 1996, and ending the period slightly lower than where it began, at approximately 17 per thousand.
Prepositions in Graphs Practice
Now, take a look at the sentences below. Decide which prepostion from the box should go in the gap and write it in.
Note: Write in small letters and do not leave any gaps or your answer may get marked as wrong.
Choose the correct word to go in the gap
| with | at | in | by | at |
| to | between | from | to | of |
Comments
Any comments or questions about this page or about IELTS? Post them here. Your email will not be published or shared.


