- Home
- Task 1 Lessons & Tips
- Useful Language for IELTS Graphs
Useful Language for IELTS Graphs
In this lesson we'll look at some useful language for IELTS graphs.
This will be language useful for introducing graphs, so it can be for any type of graph or chart, but also language specifically for graphs over time - language of change, which is commonly needed in the test.
Some Key Language
You will mostly need to report the information changes. You could describe the increase, decrease or fluctuation of data.
To obtain a high score for the lexical resources, there is a specific vocabulary that they expect you to use to write about these changes.
Introducing the Graph
First things first, you need to write an introduction, which is just a paraphrased version of the question. In the question, you’ll notice that they always start by saying something like “the chart shows.”
Don’t just repeat those words. Use any of the following synonyms instead:
- The graph illustrates...
- The diagram depicts...
- The figures demonstrate...
- The data portrays...
- The visual representation delineates...
- The illustration outlines...
- The graphic presents...
- The statistics reveal...
- The diagram exhibits...
- The chart exemplifies…
Describing the Changes
Once you get to the body of the essay, you’re expected to analyse the data and describe the information depicted on the graph/diagram.
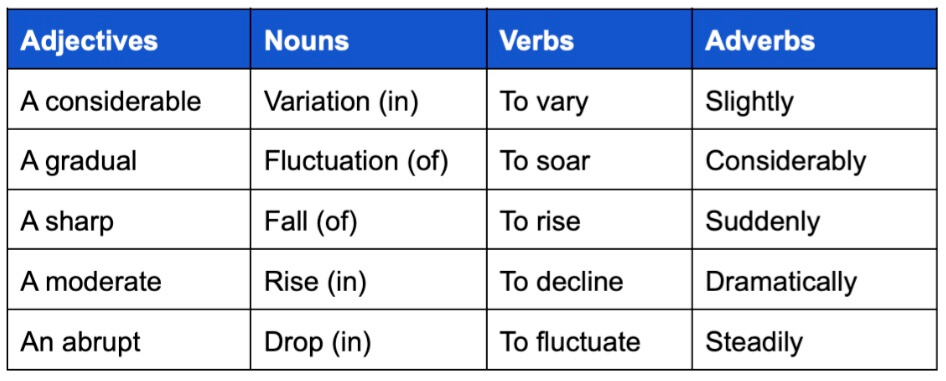
To describe the data successfully, you need to use the right vocabulary. Let’s look at some useful vocabulary for you to incorporate in your analysis.

After paraphrasing for your introduction (and not omitting your overview!), you need to report on the main features in your main body paragraphs using the above vocabulary.
It’s important to note that the above words can be used interchangeably depending on your sentence structure. For example, gradual (adj) can change to gradually (adv) and rise (noun) can change to rose (verb). For instance:
- ...a gradual rise...
- ...rose gradually...
You get scored on your ability to use various words flexibly, so ensure you do this correctly.
An Example
Let's look at some examples:
You should spend about 20 minutes on this task.
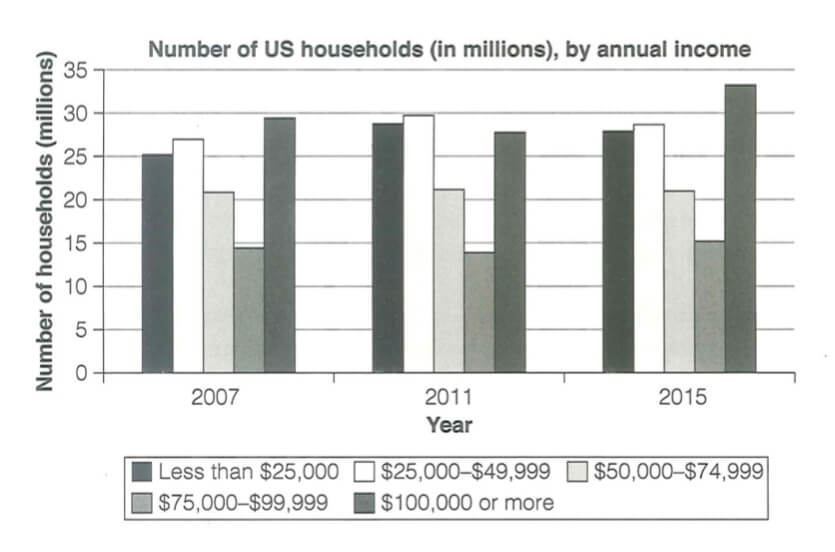
The chart below shows the number of households in the US by their annual income in 2007, 2011 and 2015.
Summarize the information by selecting and reporting the main features and make comparisons where relevant.
Write at least 150 words.
Paraphrased introduction:
- The diagram illustrates the annual income of US households during 2007, 2011 and 2015.

Based on this graph, here are some examples of how you can describe the trends. Notice the variation in sentence structures, which is important for a high score:
- From 2007 until 2011, the number of US households earning less than $25,000 annually gradually increased to just below 30 million, but then slightly dropped again in 2015.
- There was a moderate decrease in households earning over $100,000 from 2007 to 2011; however, the numbers rose considerably again in 2015.
- From 2007 until 2015, the number of households earning an annual income of $75,000 to $99,999 fluctuated moderately between 14 and 15 million.
- 2007 saw about 25 million US households earning less than $ 25,000. This increased to 29 million in 2011, but in 2015, there was a slight decline to 27 million households.
- Just under 30 million households in the US earned over $100,000 annually in 2007. By 2011, this number had steadily dropped to 27 million. However, in 2015, we saw a dramatic increase as 33 million households earned over $100,000 annually.
Don't forget that in bar charts like this you can also use language of comparison and contrast such as less than, greater than, the same, the most, in contrast etc.
Learn more about the language to compare and contrast.
It’s important to remember that you don’t want to spend more than 20 minutes on this task as it’s a short 150-word essay. That’s why it’s important to pack as much relevant vocabulary into the article as possible to show off your skills.
Comments
Any comments or questions about this page or about IELTS? Post them here. Your email will not be published or shared.


