- Home
- IELTS Quiz
- Pie Chart Gap Fill
IELTS Pie Chart Exercise
This IELTS pie chart exercise gives you the chance to practice the language for this type of chart.
This will help to improve your vocabulary knowledge, range and flexibility when you are describing a pie chart. It will also help to improve your grammar.
Pie Chart Language Points
There is no time change in the chart, so the focus is on the language of comparison and contrast. Although the information is presented here as a pie chart, it is similar to language you would use for other charts where you compare or contrast.
Some language that is particularly common to pie charts though is using the the proportion of.
When you learn language for a task 1, it is a good idea to look at 'chunks' of language rather than single words, or in other words collocations. This will improve your writing skills.
So for example, you would learn the phrase accounted for rather than just accounted or the proportion of rather than the proportion.
IELTS Pie Chart Exercise: Gap Fill
Read the question and look at the table. Then decide which word should be placed in the gap.
You should spend about 20 minutes on this task.
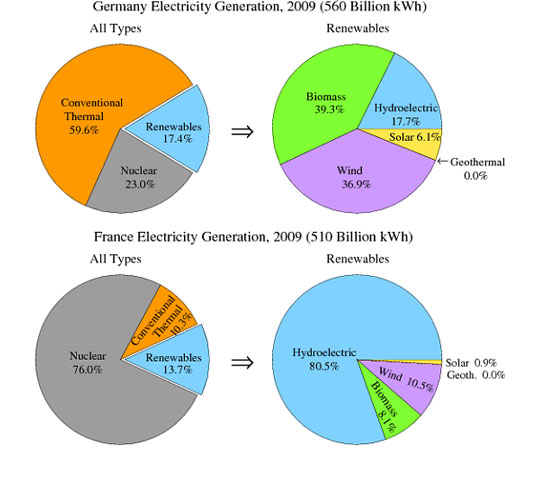
The pie charts show the electricity generated in Germany and France from all sources and renewables in the year 2009.
Summarise the information by selecting and reporting the main features and make comparisons where relevant.
Write at least 150 words.

| was lower | was very different | at approximately | the remaining | compare |
| the proportion of | was far higher | accounted for | one fifth | whereas |
IELTS pie chart gap fill exercise
Comments
Any comments or questions about this page or about IELTS? Post them here. Your email will not be published or shared.


