IELTS Computer Delivered Tests + Band Score

IELTS Pie Chart - Australian Household Energy Use

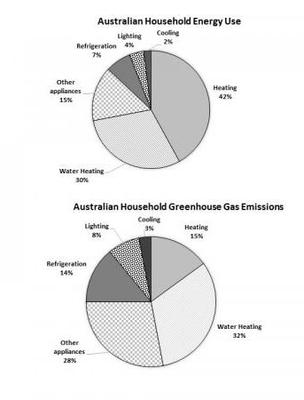
The first chart below shows how energy is used in an average Australian household. The second chart shows the greenhouse gas emissions which result from this energy use.

The first chart below shows how energy is used in an average Australian household. The second chart shows the greenhouse gas emissions which result from this energy use.

The two charts represent the use of energy by an average Australian household and emission of greenhouse gas from the use of energy respectively. Heating and water heating are the two main uses of energy and thus contributing to a significant proportion of emission as by-product from the consumption of energy.

Heating uses slightly less than a half the energy but leads to as less as 15% of the total emission of the greenhouse gas. Followed by heating is the water heating, consuming up to one-third of the energy and leading to 32% of the hazardous emission.

Strikingly, the refrigerator uses only 7% of the total energy but pollutes in the exactly double proportion. Meanwhile, the relation between use of energy and emission of harmful gas by other appliances also show similar results as only 15% of the energy is consumed while emitting almost a quarter of the total greenhouse gas.

Comments for IELTS Pie Chart - Australian Household Energy Use

Click here to add your own comments

Sep 12, 2018
IELTS writing task 1
by: Nepalese

The given 1st chart provide the information about how energy is used for different purposes in an average Australian household and 2nd chart shows the result I using such energy.

Overall,around quarter proportion of energy is used for appliances while cooking and stand by is used least approximately 10%.On the other hand green house are produced mainly due to hearing and cooling while stand by generate less greenhouse production.

In an Australian house energy used for water hearing is 23%it had slight growth of 2% to produce green house.energy consume for warm and cool is about quarter which almost led to collect near half proportion greenhouse gas.

Sep 20, 2018
your comments towards my response are appreciated
by: Haftu T

The two pie charts demonstrate the energy consumption in an average Australian household and the greenhouse emissions due to this energy use. In general, it is clearly evident that the highest energy consumption is due to heating, whereas the highest greenhouse gas emission is as a result of water heating.

Heating makes up the largest proportion of household energy consumption (42%), whilst its effect on the greenhouse gas emission is only 15 percent. Heating water requires as much as 30 percent of the total energy expenditure, which has almost similar effect towards air pollution in the form of harmful gas emissions.

The rest of household energy expenditures is accountable for the refrigeration, lighting, cooling, and other appliances, totaling 28 percent. In contrast, such minority cases result in a significant proportion of hazardous gas discharge. Each of these minor cases in the energy consumption result in as much as more than half of the total greenhouse gas emissions.

Mar 03, 2019
Currency
by: Anonymous

The data is always moving. Please indicate which year this data refers to.

Jul 07, 2019
Pls can this be corrected
by: Anonymous

The pie chart shows how energy is utilized in an average Australian home and the amount of greenhouse gas emissions from energy consumption
At a glance, it is clear that heating,water heating and other appliances account for the increase energy consumption and greenhouse gas emissions.

Jul 09, 2019
IELTS Writing Task 1
by: Mri D

The pie charts illustrate the usage of energy in an average household in Australia and greenhouse gas emissions due to this energy use.

Overall, it can be seen that heating accounts highest among other household energy usage while cooling consumes the lowest rate of the total energy. On the other hand, water heating is the largest contributing factor of greenhouse gas emissions but the percentage of gas emissions due to cooling is the smallest.

A close look at the first chart reveals that Australian citizens use heating most which contributes 42% of the total energy. Water energy absorbs 30% of the total energy consumed by households in Australia. Energy utilizes for refrigeration, lighting, and cooling are 7%, 4% and 2 % correspondingly. Energy uses for other appliances is half of the energy utilizes by water heating.

Heating causes 15% greenhouse gas emissions but water heating is the reason for 32% greenhouse gas discharge. The percentage of greenhouse gas discharges by cooling, lighting, and refrigeration are 3%, 8%, and 14% respectively. Other appliances are a contributing factor of 28% gas emissions. So it is clear that cooling, lighting, refrigeration, and other appliances result in a significant proportion of hazardous gas release.

Oct 14, 2019
answer
by: BEE

Two graphs illustrate the use of energy in an average Australian household and greenhouse gas emission as by product of this energy use. It is clear that water heating impacts greenhouse gas emission as well as energy uses.

Heating is the underlying cause of the highest proportion of energy uses whereas it is the reason of only fifteen percent of overall greenhouse gas emission by Australian household. Though other appliances requires only fifteen percent of energy consumption but causes more than one fourth of the overall greenhouse gas emission.

Strikingly lighting and refrigeration both cause double of greenhouse gas emission in terms of energy uses.

Jul 20, 2020
Australian Household Energy Use
by: Anonymous

The bar chart compares information about the rate of energy used in Australian household and it provides data about the greenhouse gas emissions as a consequence of the energy uses.

Overall, heating in general and other appliances were the most categories that spend energy on. In terms of greenhouse gas emissions, there are four main household energy sources that contributed for it.

According to the graph, 42% of energy is used on heating but almost less than a half it is a source of household greenhouse gas emissions. In addition, there is a similar percentage about water heating between energy use and gas emissions in Australian household, around 30%. However, while Australian people use only 15% of energy for other appliance, almost twice much from these sources is used for greenhouse gas emission proposals (28%).

When we look at the last percentages, energy rate used for cooling is almost the same that is used to gas emissions, 2% and 3%, respectively. The less consumption of energy is represented by lighting (4%) and refrigerator (7%). On the other hand, the percentages of these two categories are exactly the double in gas emissions.

Jun 17, 2021
Sample response
by: Ano

The energy consumption mix of Australian households reveals that energy of home heating is the number one component, taking up 42% of the total energy consumed by a household. This is followed by energy for Water Heating which comprises 30% of the total energy a household consumes. Refrigeration, lighting and cooling also contribute to energy consumption but to a lesser extend.

In terms of Green House Gas emissions, what stands out is that it is NOT home heating which is the leading contributor of greenhouse gases, but rather water heating. Water heating generates 32% of the total greenhouse gases an Australian household emits, which is more than double the greenhouse gas emissions due to home heating. Refrigeration and Lighting also emit proportionality large amounts of greenhouse gases, per unit of energy consumed.

A possible insight which could be drawn from this is that appliances used by Australian households for water heating refrigeration and cooling are comparatively not as environmentally friendly as lighting and home heating equipment installed in these households.

Sep 01, 2021
My take on the prompt
by: Jason

The information provided in the pie charts differentiates the distribution of household energy consumption in Australia on 6 categories (water heating, refrigeration, other appliances, lighting, cooling, and heating), as well as the resulting hazardous gases emitted from their use.

It is clear that among the household energy sources heating ranks number one at 42 percent; followed by water heating at 30 percent.
Looking closely, it can be observed that although heating comes as the most utilized energy source at home, it only comes second to water heating in terms of greenhouse emission during its use. Surprisingly, heating also shows the biggest gap between its use and its expected emission, showing a 14-percent difference.

In a nutshell, the rest of the categories show an increase in their greenhouse gases emission in the following percentages: 2 for water heating, 7 for refrigeration, 13 for other appliances, 4 for lighting, and finally, 1 for cooling. To reiterate, heating displays a downward trend at 14 percent, the biggest gap registered among the group.

Jun 02, 2022
Please check it
by: .....

The first chart demonstrates the information about how energy is used for domestic purposes in mid-Australia. However, the second chart illustrates information about the issues of this energy use.

Generally, Australia used a higher percentage of energy for the heating and least amount for cooling. On the other hand, a huge amount of issues creates by water heating and a small number of issues from cooling.


In Australia, many people use energy (42%) for heating. After that water heating  (30%) and other appliances(15%) used this energy higher than other domestic sectors. The least percentage consumed in cooling by 2% and lighting and refrigeration used 4% and 7% respectively.


In the first chart, energy use is higher for heating purposes but in the second chart, its emission is only 15%. However,  in water heating, other appliances, refrigeration and lighting create issued 32%, 28%, 14% and 8% respectively. The least amount of problems created by cooling is 3%.

Sep 05, 2022
2 pie charts
by: Anonymous

The collaborative pie charts illustrate how an average australian households' consumption of energy relates to the amount of greenhouse gas emitted to the atmosphere.

Overall, it is clearly observed that the two charts manifest that energy usage is inversely proportion to its contribution to greenhouse gas emissions.

In terms of the most significant feature of the chart, an average person who live in Australia consume almost two thirds (72%) of energy which accounted for all heating devices such as (plain) heating and water heating. Additionally, it comprises 42% and 30% respectively. In stark contrast, when added together, the four other categories( other appliance, refrigeration, lighting and cooling) made of only 27% of its utilization.

Relatively speaking, the consumption of heating devices as mentioned above emits slightly lesser greenhouse gasses into the atmosphere which is noted to contribute 47% accordingly. Surprisinly, the four other categories that is observed to have minimal consumption emits huge amount og greenhouse gasses which accounted for more than half of the proportion(57%).

Sep 21, 2022
from Nepal
by: Anonymous

The pie chart given illustrates, the energy consumed by different household activities by an average Australian family. Whereas, the second diagram represents, the emission of greenhouse gas caused by the use of that energy.
Overall, the highest amount of energy is consumed by heating whereas cooling consumed the least among all. On the other hand, water heating emitted a significant amount of greenhouse gas.
According to the first picture, heating tops the chart in energy usage by 42%. Likewise, water heating consumed 30% of household energy and the third position is occupied by other appliances, which is exactly 15% of the total volume. In contrast, cooling, lighting, and refrigeration consumed only 2%, 4%, and 7% respectively.
Similarly, as water heating consumed more energy, it has also emitted the greatest amount of greenhouse gas in comparison to others. However, refrigeration and lighting cast twice the amount of energy it consumed. Whereas, cooling discharges significantly less quantity of greenhouse gas.

Mar 25, 2023
creed did her best
by: creed(nepali)

The given pie chart provides information about the pictorial representation of energy used in an Australian household and their respective proportion of total greenhouse gas emissions from this energy usage.

Overall, only the heating energy usage emits less greenhouse gas whereas all the other energy usage sources which are water heating, refrigeration, lighting, cooling and other electrical appliances emits more greenhouse gas.

In an average Australian household, heating and water heating takes up to 42% and 30% respectively which is the highest proportion of total energy consumed. Whereas other electrical appliances only take up to 15%, refrigeration 7%, lighting 4% and cooling 1% of total energy usage.

These energy usages emit greenhouse gas which is responsible for depletion of ozone layer in the atmospheric region. Although heating takes the highest proportion in energy usage, it only emits 15% of total greenhouse gas. On the contrary, all the other types of energy usage like cooling, water heating and lighting emits a bit higher greenhouse gas which is 3%, 15% and 8% respectively. Also, refrigeration and other electrical appliances emit significantly higher greenhouse gas which is 14% from 7% and 28% from 15 % respectively.

Apr 02, 2023
Australian Household Energy Use
by: Muhammad Taj uddin

The given pie chart giveses information of energy used in an Australian household and their respective proportion of total greenhouse gas emissions from this energy usage.

Overall, only the heating energy usage emits less greenhouse gas whereas all the other energy usage sources which are water heating, refrigeration, lighting, cooling and other electrical appliances emits more greenhouse gas.

In an average Australian household, heating and water heating takes up to 42% and 30% respectively which is the highest proportion of total energy consumed. Whereas other electrical appliances only take up to 15%, refrigeration 7%, lighting 4% and cooling 1% of total energy usage.

All These energy usages emit greenhouse gas which is responsible for depletion of ozone layer in the atmospheric region. Although heating takes the highest proportion in energy usage, it only emits 15% of total greenhouse gas. On the contrary, all the other types of energy usage like cooling, water heating and lighting emits a bit higher greenhouse gas which is 3%, 15% and 8% respectively.And refrigeration and other electrical appliances emit significantly higher greenhouse gas which is 14% from 7% and 28% from 15 % respectively.

Jul 14, 2023
Cambridge ielts 10 test 1 writing task 1
by: Anonymous

The first pie chart illustrates how different appliances used energy in average household of australia percentagewise and second pie chart illustrate  the percentage of  emition of green house gas resulting energy used.

Overall, energy used for heating appliance was the hightest while cooling used the lowest enery in the household. In comparison, water heating contributed the most to emit greenhouse gas and emition of green house of cooling was also the least significant as previous.
Water heating accounted for 42% of enery used in australian household and had a slight increament of 2% in greenhouse gas emition than the energy used.

Energy used in refrigiration and lighting were 7% and 4% respectively and contribution of these two appliances to greenhouse gas were twice as energy used.

Emition of green house gas was 28% in other appliances , was almost twise as energy consumption with 15%.

In contrast, heating was the only one appliance that emition of green house gas was low compared with the energy used. Enery consumption in heating was at 42% and emition of green house gas was decreased by almost one third from energy consumption.

Jul 27, 2023
Writing task 1
by: Anonymous

Overall , heating stands out as the primary energy source, which accounts for the largest proportion of energy consumption.
Although, it is the highest consumption, the major source of green house gas emissions is water heating, which is almost a third of the total discharge.

While the major energy source is heating, which accounts for 42%, water heating is the second largest, which accounts
less than a third of the total energy consumption. Other appliances comprises of 15%, exactly half of water heating portion and refrigeration holds roughly al half percentage of other appliances.
Cooling and lighting have together 6% of portion which is just 1% lower than refrigeration.

Surprisingly, water heating has the highest proportion of emissions and it is just 2% more than its usage rate. Other appliances
comprises of 28%, which is less than a third of the total. Heating and refrigeration emits almost same amount and lighting and cooling together accounts for just over 10%. It is clearly seen that, cooling is the lowest consumption and that at the same time it is the lowest emissions producer.

Nov 10, 2023
Sample Response from a Nepali
by: Nabin K.C.

The two piecharts given here show how energy is used in average Australian household and greenhouse gas emissions from these uses. The studied appliances are categorized under heating, water heating, refrigerator, lighting, cooling and other appliances category.

From the overview, we can say that heating appliances utilize 42% of energy use which is the highest and cooling appliances consume just 2% of energy which is the lowest. Regarding green house gas emission water heating releases 32% of greenhouse gas which is the highest and cooling releases less than one tenth of this which is the lowest.

The order of energy use starts from cooling to heating with lighting, refrigeration, other appliances and water heating in an increasing manner lying in between two extremeties. Whereas, in case of greenhouse gas emissions we can see that cooling consists of only 3% emission expected of it's low energy consumption. However, heating just emits 15% of total greenhouse gas emission which is quite a suprise in contrast of it's highest energy use. Refrigeration generates double the percentage of greenhouse gas to it's energy use, which is also almost similar in case of other appliances and lighting. It is also seen that cooling emits one fifth of the greenhouse gases than that by heating. So, this is the summary of energy use and greenhouse gas emission from the uses in case of average Australian household.

Mar 17, 2024
Energy comsumption in Australia
by: Faisal Abrar

IELTS 10 TASK 1
The pie charts represent the percentage of energy consumption resulting in the release of greenhouse gases by an average household in Australia

It is visible that most of the energy is utilized in all sorts of heating systems therefore emitting much greenhouse gases compared to other systems whereas Other appliances also have remarkable contributions to hazardous emissions.

Though anonymous heating systems use slightly less than half of the total energy, but lead to as little as 15% of total greenhouse gas emissions, whereas water heating continues the emissions of about 32% which is proportionate to its energy utilization by 30%.
Strikingly, the refrigerator uses only 7% of the total energy but pollutes in the exactly double proportion. Meanwhile, the relation between use of energy and emission of harmful gas by other appliances also show similar results as only 15% of the energy is consumed while emitting almost a quarter of the total greenhouse gas. As cooling and lighting systems need very little energy, consequently, they emit very little greenhouse gas about 8% and 3% only.

Click here to add your own comments

Join in and write your own page! It's easy to do. How? Simply click here to return to IELTS Graph Feedback Forum.


Band 7+ eBooks

"I think these eBooks are FANTASTIC!!! I know that's not academic language, but it's the truth!"

Linda, from Italy, Scored Band 7.5
ielts buddy ebooks