IELTS Line Graph - Shop Closures
by gh
(India)

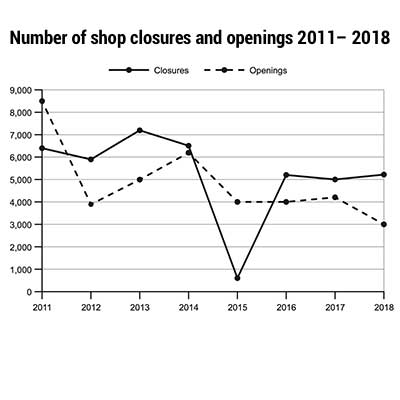
The graph shows the number of shops that closed and the number of new shops that opened in one country between 2011 and 2018.
The graph illustrates the data of one country between the year 2011 and 2018, the amount of shops that closed and the number of new shops that opened. It is clear that the shop closures nose-dived in the year 2015 while the shop openings are in a gradual decline.
In 2011, Over 8,000 shops opened but a significant decline was observed in the following year. After that there is steady increase till 2014. Meanwhile, the exact number of shops closed was slightly above 6000 in 2011, which rose to more than 7000 in the year 2013.
About 4000 shops opened in 2015, which dipped through the years and finally 3000 shops opened in the year 2018. On the other hand, the number of shops that shut down plummeted significantly to below 1000 in 2015, After that there has been a significant increase in the amount of shops closed as it went over 5000 in 2018.
In conclusion, In the beginning the number of shops opened did affect the number of shops that opened and coincided in the year 2014, However, it became independent of each other in the years that followed.
Band 7+ eBooks
"I think these eBooks are FANTASTIC!!! I know that's not academic language, but it's the truth!"
Linda, from Italy, Scored Band 7.5


