IELTS Line Graph - Radio and TV Audiences
by Jawaharali
(India)
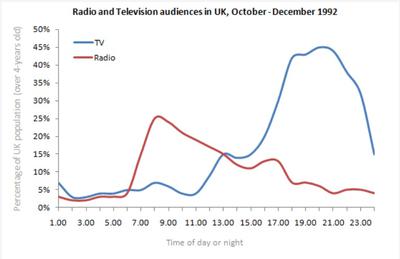
The line graph illustrates the proportion of people listening to radio and watching television in an entire day in the United Kingdom during the months from October to December in the year 1992.
Overall, the radio audiences outnumbered television viewers during the morning. However, the television audiences surpassed the proportion of people listening to radio throughout the rest of the day.
The proportion of radio of users starting at less than 10% at 6 am had a rapid rise in the following 2 hours peaking at about 28%. Meanwhile, with having no audience in the beginning of the day, the figures showed slight fluctuations of less than 5% till noon after which it had a sudden jump levelling with the percentage of radio audience at 1 am which had been experiencing decrease since 8 am.
Although the figures of television viewers remained relatively steady for 2 hours from 1 pm, it showed a dramatic increase outnumbering radio audience reaching a maximum value of about 45% at 7pm. However, it fell drastically by approximately 42% within the next 6 hours. The percentage of people listening to radio continues to decrease till 2 am except on 4 am and 11 pm where it underwent a slight increase in proportion. After 2 am, the television and radio audience again reached the same proportion and remained steady till the end of the day.
Band 7+ eBooks
"I think these eBooks are FANTASTIC!!! I know that's not academic language, but it's the truth!"
Linda, from Italy, Scored Band 7.5


