IELTS Task 1 Writing: Bar ChartOil Production Capacity
by rocky
(indonesia)
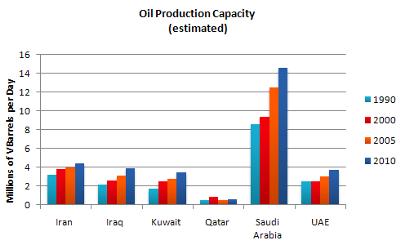
The graph compares changes in the Oil Production Capacity in millions of barrels per day in six countries.
Overall, it is clear that oil production capacity increased in all countries over a period shown. However, the most dramatic rise was apparently seen in Saudi Arabia than any of the other countries.
In 1990, Saudi Arabia produced well above 8 millions barrels per day, and this rose significantly to little above 12 million barrels per day in 2005 before soaring its output to just above 14 million barrels per day by the year 2010. In contrast, the lowest oil producing nation was Qatar under 1 million barrel per day throughout the given years although there was a modest increase in 2000.
Oil production capacity in Iran increased gradually from about 3 million barrel per day to well above 4 million barrel per day in 2010. Although the production of oil in UAE, Kuwait and Iraq tended to rise between 1990 and 2010, their production capacities reached under 4 million barrels per day by the year 2010.
==================================================
IELTS buddy
Feedback
Corrected Version:
The graph compares changes in the Oil Production Capacity in millions of barrels per day in six countries.
Overall, it is clear that oil production capacity increased in all countries over the period shown. However, the most dramatic rise was apparently seen in Saudi Arabia, which rose more than any of the other countries.
In 1990, Saudi Arabia produced well above 8 millions barrels per day, and this rose significantly to a little above 12 million barrels per day in 2005 before soaring
Oil production capacity in Iran increased gradually from about 3 million barrels per day to well above 4 million barrels per day in 2010. Although the production of oil in UAE, Kuwait and Iraq tended to rise between 1990 and 2010, their production capacities reached under 4 million barrels per day by the year 2010.
==================================================
It's a good answer for the following reasons:
- You introduce the graph by paraphrasing the rubric (not copying it)
- You have an overview at the introduction identifying the main trends
- You organize the information well by identifying similarities and differences and grouping them together (i.e. Iraq, Kuwait, UAE - similar so grouped together, the others explained separately).
- Good grammar as there are not too many mistakes and you use the correct tense (past).
- You describle all the main features but do not go into excessive detail
Comparative Structures
Be careful with these. You say this:
...the most dramatic rise was apparently seen in Saudi Arabia than any...
You can't use most with than. The structure is more than. See how I changed it.
Complex Sentences
You could try and put a few more of these in. You have 'although' twice but it would benefit by having some more (for example I put in 'which' at the beginning).
Thanks
Comments for IELTS Task 1 Writing: Bar ChartOil Production Capacity
|
||
|
||
|
||
|
||
|
||
|
||
|
||
|
||
|
||
|
||
|
||
|
||
|
||
|
||
|
||
|
||
|
||
|
||
|
||
|
||
|
||
|
||
|
||
|
||
|
||
|
||
|
||
|
||
|
||
IELTS Task 1 Writing: Line GraphOil Production Capacity
by rama
(india)
The bar graph illustrates the amount of oil produced in million barrels per day in six given countries from 1990 and 2010.
It can be seen that oil production capacities increased over the period shown. Overall, Saudi Arabia had the greatest increases in the amount of oil produced, while Qatar had the lowest producing nation.
Saudi Arabia produced well above 8 million barrels per day in 1990, which is as much as oil produced from the combined production from Iraq, Kuwait and UAE, accounting at nearly 8 million barrels per day. Over the subsequent years, oil production capacities in Saudi Arabia increased dramatically to just above 12 million barrels per day in 2005, and this even rose further to well above 14 million barrels per day by the year 2010. However, compared to Qatar, this country was the lowest oil producing region , under 1 million barrels per day .
Oil outputs in Iran was nearly 3 million barrels per day in 1990, and this rose gradually, reaching little above 4 million barrels per day in 2010. Simultaneously, the figure for Iran increased in twofold, rising from 2 million barrels per day in 1990 to 4 million barrels per day in 2010. oil production capacities in both UAE and Kuwait rose by 2 million barrels of oil in total between 1990 and 2010, although former had a slightly higher figure than latter in 1990.
==================================================
IELTS buddy
Feedback
Corrected Version:
The bar graph illustrates the amount of oil produced in millions of barrels per day in six given countries from 1990 and to 2010.
It can be seen that oil production capacities increased over the period shown. Overall, Saudi Arabia had the greatest increases in the amount of oil produced, while Qatar had was the lowest producing nation.
Saudi Arabia produced well above 8 million barrels per day in 1990, which is as much as oil produced from the combined oil production from Iraq, Kuwait and UAE, accounting at nearly 8 million barrels per day (I deleted this as you have already said it). Over the subsequent years, oil production capacities in Saudi Arabia increased dramatically to just above 12 million barrels per day in 2005, and this even rose further to well above 14 million barrels per day by the year 2010. However, compared to Qatar Saudi Arabia, Qatar this country was the lowest oil producing region, at under 1 million barrels per day.
Oil production in the remaining countries was very similar. Oil outputs in Iran were nearly 3 million barrels per day in 1990, and this rose gradually, reaching a little above 4 million barrels per day in 2010. Simultaneously, the figure for Iran Iraq increased in twofold, rising from 2 million barrels per day in 1990 to 4 million barrels per day in 2010. Oil production capacities in both UAE and Kuwait rose by 2 million barrels of oil in total between 1990 and 2010, although the former had a slightly higher figure than the latter in 1990.
Your answer is fine, though I would make reference more to the similarities of Iran, Iraq, Kuwait, and UAE.
A good answer will clearly highlight key differences and similarities (as you did with Saudi Arabia and Qatar).
You give details about the other countries, but your second paragraph would benefit from a topic sentence explaining how they followed the same pattern (as I added in) to make it clear you area aware of this.
IELTS Bar Chart - Oil Production Capacity
by Kimsiang Lim
The bar chart illustrates the capacity of oil production in millions of barrels per day for 6 Gulf nations over a 20-year-period.
It can be seen that the oil production capacity increased in all of the countries over the period mentioned. However, the most dramatic rise was seen in Saudi Arabia.
In 1990, most of the countries produced two to three millions barrels of oil per day, except Saudi Arabia and Qatar, which produced 8 millions of barrels per day and less than 1 million of barrels per day. By the year 2000, Saudi Arabia was still in the lead in oil production capacity of 9 millions of barrels per day, while the UAE' oil production capacity remained stable of 3 millions barrels per day.
All of the countries' oil production capacity increased gradually, except Qatar, which oil production capacity dropped to barely 1 million barrels per day again. Whereas, Saudi Arabia's capacity of oil production rose dramatically to nearly 15 millions barrels per day in 2010.
You can feedback on this IELTS Bar Chart about Oil Production Capacity by following the link below.
IELTS Bar Chart - Oil Production
by Nguyen Ngoc Thoai Nhi
(Ho Chi Minh,Vietnam)
The bar chart compares the amount of oil manufactured in millions of barrels per day in 6 different countries between 1990 to 2010.
Overall, it is clear that the oil produced in Saudi Arabia was the highest which surpassed others within 20 years. However, the amount of oil manufactured was lowest in Qatar whereas the other countries had the oil production capacity increased from 1990 to 2010.
In 1990, Saudi Arabia produced a large amount of oil above 8 million barrels, and then it rose steadily to above 12 million barrels per day in 2005 before growing remarkably to peak at above 14 million barrels per day at the end of the period. In contrast, the oil produced in Qatar was just under 1 million barrels in 1990, and it was more or less stable over 20-period, though there were some slight shifts.
The oil production capacity of Iran, Iraq, Kuwait saw a similar pattern. In 1990, Iran manufactured approximately 3 million barrels of oil per day, followed by Iraq and Kuwait at 2 million and 1.8 million barrels per day respectively. Iran witnessed a gradual increase from 3 million to above 4 million in 2010. Compared to the Iran figure, Iraq and Kuwait were both just under 4 million. The UAE figure stayed at approximately 2 million barrels of oil from 1990 to 2000 and began to grow slowly by almost 4 million barrels of oil by the year 2010.
Band 7+ eBooks
"I think these eBooks are FANTASTIC!!! I know that's not academic language, but it's the truth!"
Linda, from Italy, Scored Band 7.5


