IELTS Bar Chart - Global Sales of Digital Games
by Manan patel
(Kalol, gujrat,India)
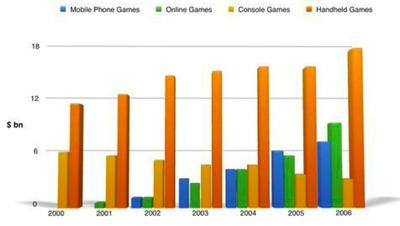
The bar graph illustrates the world wide sales of four various kinds of computerized games from the year 2000 to 2006.
Overall,it can be visible that handheld games accounted upward trend throughout the time period.Whereas,Console games recorded downward trend in given time period.
To begin with handheld games,only 13 billion dollars games were sold out in the year 2000 and this figure was steadily increased in between the time period and peaked nearly 18 billion dollars in the year 2006,which was the exceptionally higher selling followed by other years.Moreover,in the year 2000 console were sold out by almost 6 billion dollars,which was dropped by 3 billion dollars in 2006.Although,the trading of console games remained equal in 2003 and 2004,which was nearly 4 billion dollars in both the years.
Furthermore,the least amount of online games were sold in 2001 was only 1 billion dollars and this statistics was steadily expanded by 1 billion dollars till the year 2005 and climbed up by9 billion dollars in 2006.As similar to online games the highest selling of mobile phone games were seen at end of the period around 7 billion dollars,which was quite high amount as compared to other years.In contrast,the minimal selling of that game was around 2 billion dollars in 2002.
Comments for IELTS Bar Chart - Global Sales of Digital Games
|
||
|
||
|
||
Band 7+ eBooks
"I think these eBooks are FANTASTIC!!! I know that's not academic language, but it's the truth!"
Linda, from Italy, Scored Band 7.5


