Bar Chart Money Spend on Consumer Goods
by Tam
(Vietnam)
Hi again,
Please also help me with my task 1 writing. Thank you very much.
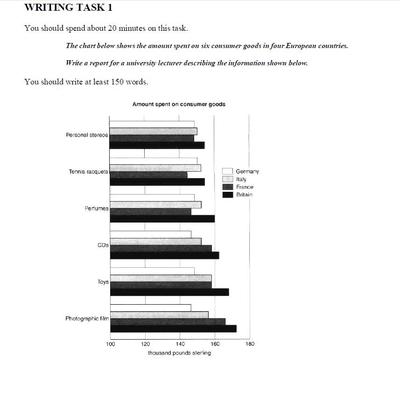
The chart gives the information about consumption of six goods in four European countries: Germany, Italy, France and Britain.
Firstly, it is clear to identify that Britain spent the most on all of six goods. In addition, personal stereos and Tennis racquets were consumed equally, about 155 thousand pounds sterling pre type and shared the lowest place simultaneously. Meanwhile, the highest used goods, Photographic film accounted for over 170 thousand pounds.
On the other hand, Germany’s consumption fluctuated negligibly in six types of goods. In details, this country spent the most on Tennis racquets by over 150 thousand pounds while the lowest consumption for Photographic film accounted for 130 thousand pounds. In comparison, Italy spent almost 160 thousand pounds on Toys, the highest usage in this country and used at least for Personal Stereos, approximately 153 thousand pounds. Finally, France’s consumer goods showed the significant disparities. Evidently, this country spent around 165 thousand pounds on Photographic film, the peak is six goods while just used about 145 thousand pounds for Tennis racquets, the nadir in this field.
To conclude, as the different demands, six countries had the relentless changes of consumption.
Comments for Bar Chart Money Spend on Consumer Goods
|
||
|
||
|
||
Band 7+ eBooks
"I think these eBooks are FANTASTIC!!! I know that's not academic language, but it's the truth!"
Linda, from Italy, Scored Band 7.5


