Bar Chart - Average Monthly Expenditure
by Shiny Star
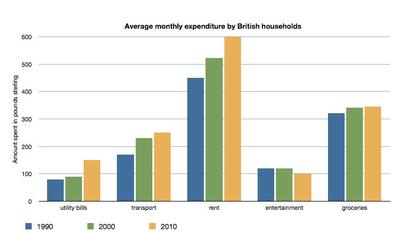
The bar chart illustrates the average monthly expenses of a UK household for utility bills, transport, rent, entertainment and groceries, in three years (1990, 2000 and 2010). All the money spent is in pounds sterling.
Overall the maximum money spent was in the year 2010 and then in 2000. The largest expenditure was on rent in all the years, followed by groceries. Whereas minimum amount of money was spent on entertainment as well as on utility bills. The maximum notable differences in expenditure was observed for the commodities such as rent, transport and utility bills.
Rent being the most expensive commodity touched the peak of 600 in 2010, with slightly more than 500 and considerably less than 500 in the following years (2000 and 1990 respectively). UK citizens spent more than 300 and around 100 pounds on groceries and entertainment respectively every given year.
On the other hand, Money spent for transport in 1990 was under 200, which is around 250 in the later years. The expenditure of utility bills in 2010 accounts for around 250 in comparison to below 100 in the earlier years.
Band 7+ eBooks
"I think these eBooks are FANTASTIC!!! I know that's not academic language, but it's the truth!"
Linda, from Italy, Scored Band 7.5


