Task 1 Bar Chart: Effectiveness at Work
by Phuong Nhung Nguyen
(Hanoi, Vietnam)
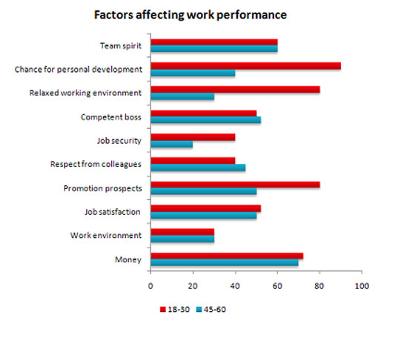
The graph illustrates the information about the factors that affect the work effective of workers in a company. Workers are divided into two groups depending on their ages: 18 – 30 and 45 – 60 year old group.
As a general trend, most of the factors influence the former more than the latter.
For younger people, five top factors are chance for development, unstressed working environment, money, promotion prospects and team spirit. The first one shows the highest number by just under 90 and the rest ones are nearly the same, ranging from 65 to 75. The other matters’ numbers are below 60 and work environment stands at the bottom with only 30.
For older employees, the trend is quite different. Team spirit and money are still lead, reaching 70 and well over 60 respectively while job security experiences the lowest figure by 15.
The differences between two groups see significantly when considering chance for personal development due to there are 60 workers of 18 – 30 aged group more than that of the rest group. However, in terms of work environment and team spirit, two groups are equal in number and for competent boss and respect from colleagues, the mid – aged group overtakes slightly the younger one with les than 15.
________________________________________________
IELTS buddy
Feedback:
Revised version:
The graph illustrates information about the factors that affect the work effectiveness of workers in a company. Workers are divided into two groups depending on their ages: 18 – 30 year olds and 45 – 60 year olds. Overall, it can be seen that most of the factors influence the former more than the latter.
For younger people, the five top factors are chance for development, unstressed working environment, money, promotion prospects and team spirit. The first one shows the highest number at just under 90 and the other ones are nearly the same, ranging from 65 to 75. The other matters’ (can’t say this, I think you mean ‘other factors’?) numbers are below 60 and work environment stands at the bottom with only 30.
For older employees, the trend is quite different. Team spirit and money lead, reaching 70 and well over 60 respectively, while job security is the lowest figure at 15.
The differences between the two groups are the most noticeable when considering chance for personal development due to the fact that there are 60 workers more in the 18 – 30 age group than that of the other group. However, in terms of work environment and team spirit, the two groups are equal in number and for competent boss and respect from colleagues, the mid–aged group overtakes the younger one by 15.
====================
Further Comments:
“As a general trend” = we don’t tend to write this. “Overall, it can be seen that….” is ok (this gets a complex sentence in as well).
due to + noun
due to the fact that + Subject Verb
Rest = remainder – you mean ‘other’
Another way to organize graphs like this is to look at the factors which are higher in one group than the other.
Example:
Paragraph One:
Group 1 = Factors affecting work performance of 18-30 much more than 45-60
i.e. chance for personal development, relaxed working environment, job security, promotion prospects
Paragraph Two / Three:
Group 2 = Those equal or nearly the same (giving some detail about how they differ etc)
Comments for Task 1 Bar Chart: Effectiveness at Work
|
||
|
||
|
||
|
||
|
||
|
||
|
||
|
||
|
||
|
||


