Task 1: Line Graph - Unemployment in US and Japan
by mehreen

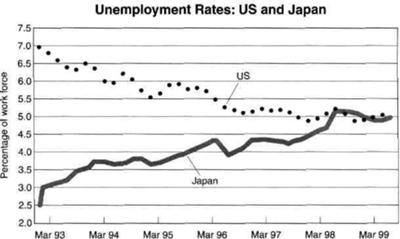
THE GRAPH SHOWS THE UNEMPLOYMENT RATES IN THE US AND JAPAN BETWEEN MARCH 1993 AND MARCH 1999.
The line graph compares figures for unemployment in America ad Japan over a period of six years.
Overall, the unemplyment rate was higher in Japan,compared to the US. However,the proporion of workforce in Japan rose steadily between March 1993 and March 1999, while the figure for America fell.
In March 1993,US had 7% of workfore, in comparison with, only 2.5% in Japan.Between 1993 ad 1997, the American workforce showed a downward trend,whereas the figure for Japanese had un upward trend.
By March 1996,the unemployment rate increased in America as the percentage of workforce fell gradually, reaching 5.5%. By contrast, in Japan, the unemployment rate decreased as the figure for workforce rose steadily,becoming above 4%.
The percentage of workforce in America fell over next three years,reaching 5% in March 1999. There was an overall fall of 2% in the US workforce over this period of six years.
On the other hand,the proportion of Japanese workforce rose over to 5% in march 1998. The figure plateaued between March 1998 and March 1999. There was an overall rise of 2.5% in workforce over a period of six years.
It is interesting to note that both the US and Japan had 5% of workforce by the end of the period shown.
I am note sure whether I ve interpreted this graph correctly.iam
=====================
IELTS buddy
Feedback
Corrected Version:The line graph compares figures for unemployment in America a
nd Japan over a period of six years.
Overall,
at the beginning of the period, the unempl
yment rate was higher in Japan US compared to the US Japan. However, the propotion of the workforce unemployed in Japan rose steadily between March 1993 and March 1999, while the figure for America fell.
In March 1993, US had 7% of workforce unemployment, in comparison with only 2.5% in Japan. Between 1993 and 1997, the American workforce unemployment rate showed a downward trend, whereas the figure for Japanese had
an upward trend.
By March 1996 (don’t do this, it will be confusing – you got to 1997 in the paragraph above, but now you have gone back a year. This will make it difficult to follow), the unemployment rate increased in America as the percentage of workforce fell gradually, reaching fell to 5.5%. By In contrast, in Japan, the unemployment rate decreased as the figure for workforce rose steadily, becoming reaching above 4%.
The percentage of workforce unemployment in America fell over the next three years, reaching dropping to 5% in March 1999. There was an overall fall of 2% in the US workforce over this period of six years.
On the other hand, the proportion of Japanese workforce not working rose over to to over 5% in march 1998. The figure plataeud plateaued between March 1998 and March 1999. There was an overall rise of 2.5% in the workforce the number of people not working over a period of six years.
It is interesting to note that both the US and Japan had 5% of workforce unemployment by the end of the period shown.
===================
Further comments:
You have to always look carefully to make sure you have identified the correct topic of the graph. You refer to the workforce, but you should be referring to
unemployment as this is what is being shown with the percentages.
I think you may have got mixed up when you analyzed the graph and misunderstood it. On the left axis it is referring to the 'percentage of the workforce who are not working'.
reaching = this is for something going up
There are a lot of corrections on your graph, but it is not as bad as it looks! You do have some good language in there, a lot of the errors have come from you misunderstanding the graph.
Review the language used for writing about 'change' as you do make some errors with this.
You need to vary your language a bit as some of your structures are a bit repetitive as well.
IELTS Task 1 Writing: Line GraphUnemployment Rates in Japan and USA
by simran
(india)

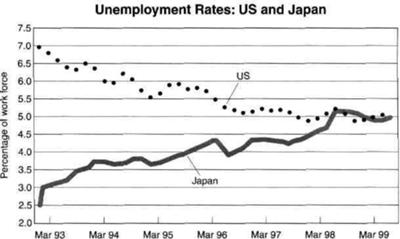
THE GRAPH SHOWS THE UNEMPLOYMENT RATES IN THE US AND JAPAN BETWEEN MARCH 1993 AND MARCH 1999.
The line compares changes in the percentage of people who were unemployed in the USA and Japan over a period of 6 years from 1993 to 1999
Overall, the chart indicates that the proportion of unemployment rates in the USA declined gradually over the period shown. The figures for Japan increased, however.
There were 7% of Americans who were unemployed in march 1993, according to the information available from the chart shown. . The figure for Japan, on the other hand, was noticeably lower, at just 2.5%
Between March 1993 and March 1997, there was changes in the percentage of unemployment rate in the USA , as the figure fell markedly to 5% until about March 1997. Despite some minor fluctuation, the figure remained relatively stable for the next years, ending the final period to about 5%. By contrast during the same period of time , the percentage of unemployment rate in the japan increased gradually for the subsequent years rising to about 4.5% in March 1996, before rising to well above 5% in March 1998. Since then, there was a period of stability in the percentage of unemployment part from a slight fluctuation.
==================================================
IELTS buddy
Feedback
Corrected Version:
The line graph (you can't just say 'the line') compares changes in the percentage of people who were unemployed in the USA and Japan over a period of 6 years from 1993 to 1999.
Overall, the chart indicates that the proportion of unemployment rates in the USA declined gradually over the period shown. The figures for Japan increased, however.
There were 7% of Americans who were unemployed in March 1993, according to the information available from the chart shown. The figure for Japan, on the other hand, was noticeably lower, at just 2.5%
Between March 1993 and March 1997, there were changes in the percentage of unemployment rate in the USA, as the figure fell markedly to 5% until about March 1997. Despite some minor fluctuation, the figure remained relatively stable for the next few years, ending the final period at about 5%. By contrast, during the same period of time, the percentage of unemployment rate unemployed in the japan increased gradually for the subsequent years (using 'subsequent' here is confusing as the last year you mentioned was 1997, not 1993) rising to about 4.5% in March 1996, before rising to well above 5% in March 1998. Since then, apart from a slight fluctuation, there was a period of stability in the percentage of unemployment part from a slight fluctuation
FURTHER COMMENTS
Its a good answer overall, but just a few points:
Subject
Be careful with your subject when you describe graphs.
You can talk about the 'percentage of unemployment' or 'unemployment rates' but you can't use both like you do i.e.' the percentage of unemployment rate' (this is wrong).
Percentages and rates are both measurements.
Comparing Data
You do make comparisons of data in your graph which is good, but an important point that you should mention is that they are both equal at the end and follow the same pattern.
This is a key point so you should make specific reference to it.
Unemployment Rates US and Japan
by Ann moses
(India,Kerala,Wyanad)
The graph shows the unemployment rates of two countries the US and Japan. The rates are measured in temrs of percentage of workforce.
Overall a quick glance reveals that the the US had the highest proportion of workforce in the begining but was reverse in the case of Japan. It is also noteworthy to point out that the US had a decreasng trend as compared to Japan which experienced an upward trend.
To begin with, In March 1993,the US workforce rate was 7.0% , while in the case of japan the workforce rate was 2.5%. However the proportion of US started to decline later in 5 years with an erratic pattern and slightly fell to 5.0% in march 1999.
Moreover, In contrast, Japan had a climb to 3.0% in the initial year. The figure then began to climb gradually with variations throughout the period and accelarated to above 5.0% in march 1998, but by March 1999, the workforce rate had dropped and it touched the point which was the same as the US.
WORDS-278.
Click here to post comments
Join in and write your own page! It's easy to do. How? Simply click here to return to IELTS Graph Feedback Forum.
IELTS Line Graph - Unemployment
by mahmood
(oman)

Unemployment rate in US and Japan - 1993-1999
The line graph compares unemployment figures in USA and Japan between the period ( 1993 – 1999 ) in March.
According to the picture, the difference was large in unemployment rates between the two countries at the beginning of the period, but the numbers began to converge at the end of the period. Unemployment rates began to increase dramatically in Japan, while in the United States it also began to decline dramatically until it reached a point of convergence at the same level at the end of the period.
The maximum rise in the unemployment rate in the United States at the beginning of the period was at a rate of 0.7 %, unlike Japan, which was the maximum rise at the end of the period at a rate of 4.5 %, as for the decrease, the maximum decrease in the unemployment rate in Japan reached the beginning of the period at a rate 2.4 %, in contrast to the unemployment rate in the United States, where it was the maximum decline at the end of the period at a rate 4.1 %.
Click here to post comments
Join in and write your own page! It's easy to do. How? Simply click here to return to IELTS Graph Feedback Forum.
Umemployment US and Japan
by JIJI MOLE V R
The given line chart depicts the information about the rate of unemployment in two countries namely Japan and the US during the period between March 1993 and March 1999.
Overall, the employment rate in the US decreased over the period of 7 years. However the rate increased in Japan during the period between March 1993 and march 1999.
The rate of unemployment was 2.5% and 7% in 1993 in Japan and US respectively. Between 1993 and 1997 Japan witnesed a gradual increase and at the same time there was a downward tendency in the rate in the US.By the year 1998 both the countries intersected each other reaching a point nearly 5%. Beyond this, the percentage has increased slightly in Japan and the rate shown a sudden fall in the US.But in the year 1999, the rates of unemployment in US and Japan stood still at about 5% and 4.9% respectively.
Click here to post comments
Join in and write your own page! It's easy to do. How? Simply click here to return to IELTS Graph Feedback Forum.
Band 7+ eBooks
"I think these eBooks are FANTASTIC!!! I know that's not academic language, but it's the truth!"
Linda, from Italy, Scored Band 7.5


