IELTS Line Graph: Governments Expenditure on Research
by Phuong Anh
(Vietnam)
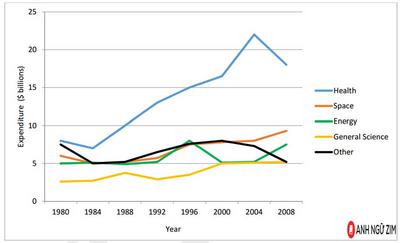
The line graphs show information about the US government's expenditure spending on research in five fields ( health, space, energy, general science, and other) from 1980 to 2008.
Overall, it is obvious that the US government spent the most expenditure on health while general science was the least.
Beginning at around $10 in 1980, there was a slight decrease in the number of expenditures the government spent on health in 1984 before increasing sharply over the four-year period and hitting the highest point in 2004. However, a decline again was seen in 2008. In contrast, the amount of money that the government spent on general science was the lowest over the period. A fluctuation was seen over 20 years before remaining unchanged from 2000 to 2008.
Over the period, both energy and space witnessed a climb from $5 billion and $6 billion to almost $7 billion and $9 billion. Whereas the amount of money the government spent on other saw a drop from $8 billion in 1980 to $5 billion in 2008


