IELTS Bar Chart: Eating of Fast Food in USA
by Marco

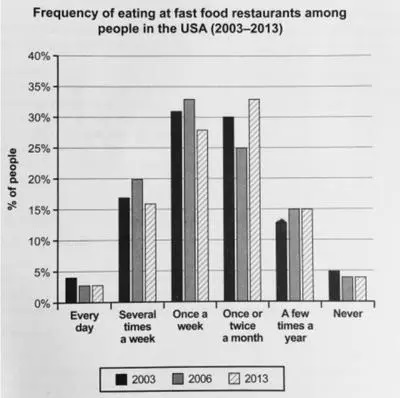
The chart shows how frequently people in the USA ate in fast food restaurants between 2003 and 2013.
The bar chart demonstrates how often of respondents ate in fast food restaurants in the America from 2003 to 2013.
Overall, the highest among of respondents ate in fast food restaurants once a week in 2003 and 2006 whereas once or twice a month in 2013. People who ate every day were the lowest ratio.
In 2003 and 2006, roughly with 32% and 33% of respondents were having fast food at restaurants once per week which was the largest proportion. However, the same segment in 2013 was dropped to nearly 27% and took place by one or two time a month with around 33%. The same frequency in 2003 and 2006 were dipped to 30% and 25% respectively. The trend of few times a week was 17% in 2003 and moderate rose to 20% in 2006, finally stepped down at 16%.
Several times a year between 2006 and 2013 were same percentage at 15% and slightly decreased to approximately 13%. There have 2 segments were below 5% in between 2003 to 2013. Around 4% of people having meal at fast food restaurants every day in 2003 and 3% in 2006 and 2013. Similarly, 5% proportion has never eaten at fast food restaurants in 2003 and gradually went down at 4% in both 2006 and 2013.
Thank you.


