IELTS Bar Chart: GDP of the UK
by Mia
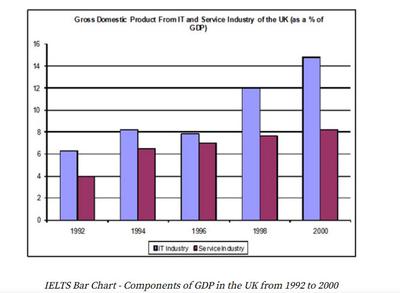
The bar graph illustrates the components of GDP between IT industry and Service industry in UK from 1992 to 2000 measures in percentage.
Overall, the GDP of both IT industry and Service industry is seamlessly rising even though there is a little fall of IT service in 1994 and 1996. The IT industry is appeared to have a higher rate than Service industry.
As it is described, the IT industry seems to rise a little during 1992 and 1994 but appear to have drop somewhat between 1994 and 1996. But as you can see from 1996 till 2000, the industry continues to constantly advance.
For the Service industry; it is seems that in between of 1992 and 1994, we could say that it increased the same amount as the IT industry but following in 1994 and 1996 the amount of the rise is small but still consistent. In 1996 and to 2000, the rise is small, but it is constant.
Band 7+ eBooks
"I think these eBooks are FANTASTIC!!! I know that's not academic language, but it's the truth!"
Linda, from Italy, Scored Band 7.5


